Month: December 2024

  • Biodiversity Monitoring with eDNA: How AI is Speeding Up DNA Analysis

    Biodiversity Monitoring with eDNA: How AI is Speeding Up DNA Analysis

    Biodiversity, the remarkable variety of life in all its forms—from microscopic bacteria to towering trees and large mammals—underpins the health of ecosystems across the globe. It ensures that natural processes such as pollination, nutrient cycling, and water purification operate efficiently, enabling both wildlife and human communities to thrive. However, biodiversity is under immense pressure: habitat destruction, pollution, climate change, and overexploitation are driving species to decline or even go extinct at an alarming rate. Monitoring this diversity in a timely, accurate way is essential for developing effective conservation strategies. Yet, traditional monitoring methods can be slow, labour-intensive, and require a high degree of specialised expertise. This is where Environmental DNA (eDNA) and Convolutional Neural Networks (CNNs) come into play.

    Why eDNA Matters for Conservation

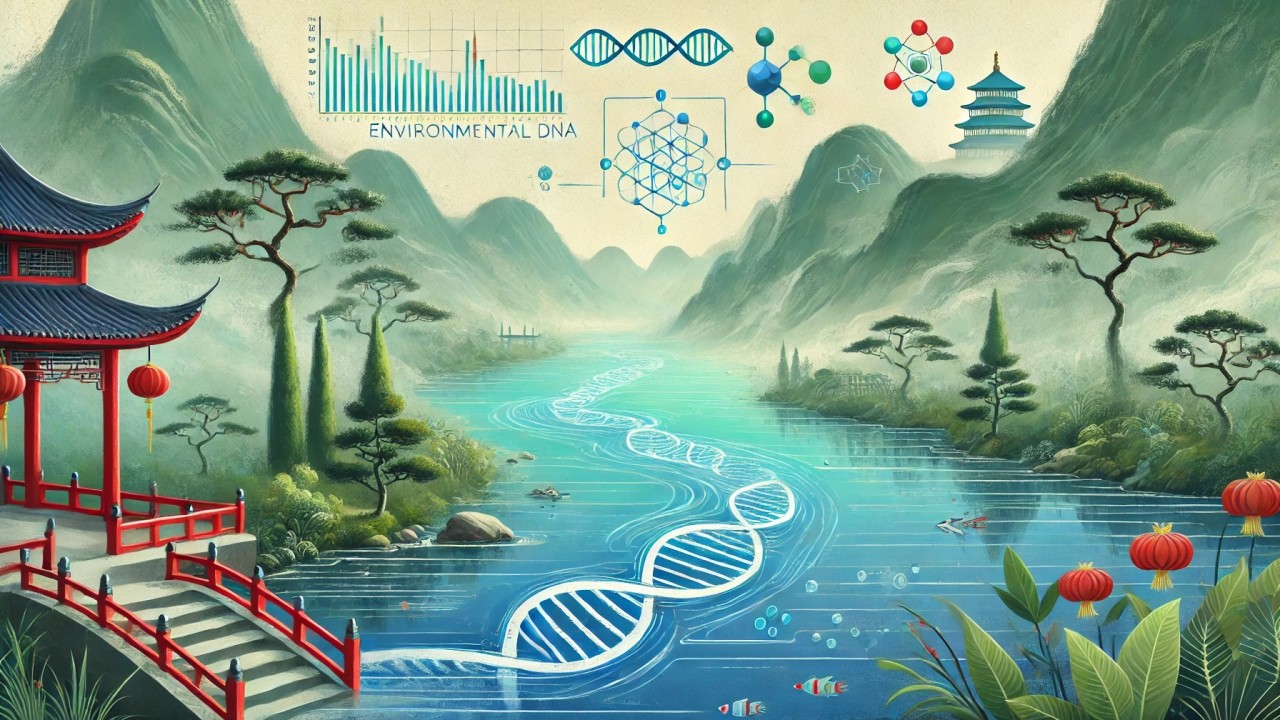
    Environmental DNA refers to the genetic material left behind by living organisms in their surroundings. When researchers collect samples from water, soil, or air, they gather these tiny traces of DNA. By extracting and sequencing this DNA, scientists can discover which species are present without ever laying eyes on them. Despite its transformative potential, eDNA analysis also poses challenges. Traditional bioinformatics methods used to match DNA sequences to specific species are time-consuming and often demand high computational power. As the number and size of datasets grow, these bottlenecks can stall crucial conservation efforts.

    Convolutional Neural Networks (CNNs): AI Supercomputers for DNA Analysis

    Convolutional Neural Networks are a class of artificial intelligence algorithms inspired by how the human brain processes visual information. They are widely used to recognise images and distinguish among objects in a picture. In conservation science, CNNs have proven effective in automatically identifying species, e.g., from camera-trap photos. The network “learns” from labelled examples—for instance, images tagged with “leopard,” “fox,” or “whale”—and uses virtual “filters” that slide over the image, detecting patterns like spots, stripes, or specific body shapes. Over time, the CNN refines its parameters to improve its accuracy, akin to how people get better at identifying animals the more they observe them.

    But it gets better. Researchers are now using CNNs’ pattern recognition ability beyond images and leveraging them to identify recurring features in complex data. DNA sequences are essentially strings of letters (A, T, C, G) with specific patterns and variations. By adapting CNN architectures to handle genetic information, scientists can train these networks to match sequences to species at high speed, potentially transforming eDNA analysis.

    An Interesting Case Study

    A pioneering study took place in the tropical rivers of French Guiana, located in South America. Researchers collected more than 200 water samples from the Maroni and Oyapock rivers, filtering around 30 litres of water per site to gather traces of eDNA shed by resident fish. They focused on the “teleo” region of the 12S rRNA mitochondrial gene, a well-established target for identifying freshwater fish.

    The dataset encompassed nearly 700 million sequences, of which approximately 205 million were relevant to the fish species under study. The primary goal was to compare how quickly and accurately a CNN could process these eDNA sequences against the outputs of a traditional bioinformatics pipeline called OBITools, which is widely used in metabarcoding workflows.

    Training the CNN and Network Architecture

    To train their CNN, the team first assembled a reference database of DNA sequences from 368 fish species known to inhabit Tropical South America. One hurdle they faced was that the reference database did not perfectly capture the range of sequence variations found in real-world samples. To address this, they employed data augmentation—a method borrowed from image processing and now adapted to genetic data. Controlled mutations were introduced to the reference sequences, including random insertions, deletions, and substitutions at a rate of around 5%. This step simulated the kinds of errors that appear when DNA is amplified and sequenced in the lab.

    These synthetic errors expanded the dataset, improving the CNN’s ability to handle noisy or imperfect data. Each DNA sequence was then converted to a numerical representation so the network could interpret the spatial arrangement of nucleotides. Canonical bases (A, T, C, and G) were represented as distinct vectors (for instance, A might be [1, 0, 0, 0]) and ambiguity codes (like “W,” which can mean A or T) were likewise encoded with partial probabilities (e.g., [0.5, 0.5, 0, 0]). This encoding allowed the CNN to spot patterns even when the sequence data contained unknown or ambiguous segments.

    In designing the architecture, the researchers sought to prevent overfitting—where a model memorises training examples but fails to generalise to new data. They achieved this through dropout regularisation, which randomly turns off a fraction of neurons (think of them as problem-solvers or “friends” in a team) during training. It is like occasionally letting some friends take a break so that the rest learn to solve problems on their own. This stops them from relying too much on any one friend. In addition, the network employed leaky rectified-linear activation functions- think of this as leaving the door slightly open even when the signal is negative, so a tiny bit of information still gets through, unlike standard ReLU activation, which outputs zero for negative inputs. This helps avoid “dead neurons,” ensuring the CNN still passes some information even when inputs fall below zero.

    Application of CNN to Raw and Cleaned eDNA Data

    Once trained, the CNN was tested on both raw Illumina metabarcoding data—the direct output from the sequencing machine—and on “cleaned” data that had already undergone some standard filtering steps (removing low-quality reads or contaminants). Remarkably, the CNN delivered nearly identical results for both datasets, showcasing a natural resilience to noise. This means the network was capable of picking out real biological signals even when the data contained errors or ambiguities common to large-scale sequencing.

    To refine results further, researchers applied a minimum read threshold to remove extremely rare sequences, which can sometimes be artefacts or random errors. This thresholding step sharpened the overlap between the CNN and OBITools outputs. In other words, both methods agreed more closely on which species were genuinely present in each sample.

    Results and Comparison with Historical Records

    When researchers compared the CNN’s output to OBITools and historical records—data from past studies or field surveys—there was substantial agreement on species composition. The two methods shared most of the species they identified, although each detected some species that were not found by the other. Notably, the CNN tended to pick out more species than OBITools or historical records, particularly in the raw data. These additional detections might represent legitimate new observations—possibly capturing species that are rare or poorly documented—but they could also be false positives triggered by noisy sequence reads.

    Applying CNN to cleaned reads reduced unique-to-CNN detections without lowering the number of shared detections. This implies that a portion of CNN’s “extra” species were indeed artefacts of the raw data rather than actual discoveries. However, many of CNN’s findings remained consistent with OBITools and past records, reinforcing that the network can reliably identify species with minimal preprocessing.

    Perhaps the most striking difference was speed: The CNN processed around one million sequences per minute, about 150 times faster than OBITools. For large-scale eDNA projects, where millions or even billions of reads must be parsed, this acceleration could radically streamline workflows and enable near real-time biodiversity assessment.

    The Bigger Picture: Enhancing Conservation Strategies

    Rapid, accurate biodiversity monitoring is indispensable for effective conservation. CNN-driven eDNA analyses allow field teams, government agencies, and environmental organisations to detect changes in species distribution in days or weeks rather than months or years. This agility is vital for quick interventions, such as curtailing invasive species, safeguarding critically endangered wildlife, or restoring damaged habitats.

    Moreover, real-time data supports a more adaptable management style. For instance, if a particularly vulnerable fish population shows a sudden drop in eDNA signals, local authorities can adjust fishing quotas or implement conservation measures almost immediately. In essence, pairing CNN speed with the broad reach of eDNA fosters a proactive, science-driven approach to ecological stewardship.

    Embracing Technology for a Sustainable Future: AI as a Tool for Environmental Stewardship

    Bringing CNNs to eDNA analysis underscores how technology can be harnessed to protect our planet’s biological wealth. By automating laborious tasks and simplifying complex data interpretation, artificial intelligence broadens participation in environmental research. No longer must every region rely on highly specialised teams to study biodiversity; with user-friendly protocols and cloud-based platforms, even smaller institutions or citizen-science groups can join in data collection and analysis efforts.

    The promise of CNNs in eDNA monitoring goes beyond simple speed or accuracy. It represents a shift in how conservationists and policymakers think about environmental management. When data can be gathered efficiently and processed almost in real-time, interventions become nimble and target the most pressing threats. As climate change, pollution, and habitat loss continue to pose significant risks, the ability to rapidly detect declines or new invasive species could make all the difference in preserving fragile ecosystems.

  • Combining eDNA and Machine Learning for River Ecosystem Health and Biodiversity Monitoring

    Combining eDNA and Machine Learning for River Ecosystem Health and Biodiversity Monitoring

    The health of our rivers is essential for biodiversity, water security, and overall ecological balance. However, assessing river ecosystems—often referred to as ecological status—has traditionally relied on studying visible organisms like fish, insects, and algae. However, what if untapped microscopic life, like bacteria and other microorganisms, could give us deeper insights? Recent research from China uses environmental DNA (eDNA) and machine learning (ML) to revolutionise this process. Here is why it matters and what it could mean for the future of ecological monitoring. But first, the basics.

    What is eDNA and Why Should You Care?

    Environmental DNA, genetic material shed by organisms into their surroundings, serves as a biological footprint that reveals the presence of various life forms, including microscopic bacteria and microbial eukaryotes. These microorganisms are sensitive indicators of water quality and ecosystem health. By collecting and analysing eDNA, scientists can tap into a vast reservoir of ecological information without the need for invasive sampling techniques.

    However, eDNA has its limits.

    Machine Learning: Unlocking the Potential of eDNA

    Analysing DNA typically requires extensive databases to identify which organisms it belongs to, and many microorganisms are not represented in these databases. This could leave up to 90% of DNA sequences unidentified, wasting a critical portion of data.

    This is where machine learning comes into play. By using supervised machine learning algorithms, researchers can bypass the limitations of taxonomic identification and directly link DNA sequences with ecological health indicators, such as the Trophic State Index (TSI) and Water Quality Index (WQI).

    The study conducted on the Dongjiang River in China exemplifies the effectiveness of this approach.

    The Dongjiang River Case Study: A Deep Dive into the Approach

    The researchers sampled 52 sites spanning the Dongjiang River in southeast China, encompassing a variety of environmental gradients caused by human activities. At each site, three 1-litre surface water samples were collected using sterile bottles. The samples were filtered using 0.45μm nylon membranes to isolate DNA, which was then stored for processing. DNA was extracted using a commercial kit and amplified using specific primers targeting bacterial and microbial eukaryotic gene regions. Samples were sequenced using Illumina MiSeq technology. For the bioinformatics, Operational Taxonomic Units (OTUs), representing groups of microorganisms, were clustered using 97% similarity thresholds.

    However, significant portions of OTUs (40-90%) remained unidentified due to database limitations.

    Machine Learning and eDNA Index Development

    The researchers introduced machine learning algorithms, specifically Random Forest, to bridge the gaps left by incomplete DNA databases. Please take a look at my previous article for a simple explanation of how this algorithm works. This algorithm is not constrained by the need to identify organisms by name. Instead, it looks at patterns in the DNA data and learns how these patterns correlate with ecological health indicators. Using a strategy called a “taxonomy-free” approach, the researchers trained the machine learning model to do two things:

    Classify Unknown OTUs: Instead of identifying organisms by name, machine learning used patterns in DNA sequences to classify organisms into ecological tolerance groups that reflect pollution sensitivity.

    Align Data with Ecological Health Indicators: Machine learning mapped eDNA data directly to established metrics like the Trophic State Index (TSI) (measuring nutrient levels) and Water Quality Index (WQI) (measuring pollution levels). This makes it possible to evaluate river health even if the DNA is unidentifiable.

    Key Outcomes of eDNA-ML Integration

    Holistic Use of Microbial Data: By bypassing the need for precise organism identification, the Metabarcoding-eDNA Index (MEI) created through machine learning allows 100% of DNA data to be analysed. Traditional taxonomy-based methods, in contrast, could only use 30% of data.

    Enhanced Microbial Classification: About 90% of unidentified OTUs were successfully grouped into ecological categories (low to high pollution tolerance). This classification underscores machine learning’s ability to extract meaningful patterns from vast unknowns.

    Gradient of Health Along the River: Evaluating the Dongjiang River’s ecological state, MEI revealed that nearly 50% of sites had poor or very poor ecological conditions, particularly in downstream areas near urban and agricultural zones, correlating with high nutrient inputs and land-use intensity. Upstream areas showed better conditions, indicating lower human and agricultural impact.

    The Future of Ecosystem Monitoring: Machine Learning-driven Insights From eDNA Data

    While this approach shows immense promise, much work is still needed before it becomes a standard tool for monitoring rivers worldwide:

    · Database Expansion: A comprehensive global effort is required to expand DNA reference databases to reduce the number of unidentified microbes.

    · Regional Calibration: Algorithms need to be trained and validated across regions using local data to ensure accuracy under different conditions.

    · Long-Term Testing: Reliable tools take years of testing to ensure stability and precision when used in ongoing monitoring programs.

    As urban expansion and climate change pose increasing threats to freshwater systems, eDNA combined with machine learning offers a game-changing alternative. This method is non-invasive, scalable, and cost-effective, ideal for environments under stress.

    Beyond rivers, the applications of this technology could extend to other aquatic systems like lakes, wetlands, or even oceans, where monitoring microbial ecosystems is equally critical.

    Expect widespread adoption to take time as frameworks like this one undergo further testing and refinement. However, once fully realised, methods like MEI could redefine global standards for ecological assessment.

    The marriage of eDNA and machine learning is a powerful approach to ecological monitoring. It reveals previously missed interaction among microorganisms, offering actionable insights that traditional methods simply cannot achieve. By embracing these innovations, we are not just advancing the tools for monitoring rivers; we are laying the foundation for more sustainable water management systems for a healthier planet.

  • The Synergy of AI and eDNA: A New Era in Biodiversity Conservation

    The Synergy of AI and eDNA: A New Era in Biodiversity Conservation

    As global biodiversity declines at an alarming rate, the need for effective monitoring tools has never been more pressing. Human activities—including pollution, climate change, invasive species, and habitat loss—have placed immense strain on ecosystems, unsettling the delicate balance of nature. In response, scientists are increasingly turning to innovative technologies to better understand and mitigate these disruptions. Among the most promising approaches is the integration of environmental DNA (eDNA) analysis with machine learning, offering a remarkable new vantage point for guiding conservation efforts.

    A New Framework for Ecological Insight: eDNA and Machine Learning

    What precisely is eDNA? In essence, it is genetic material that organisms release into their surroundings—through skin cells, saliva, urine, and other biological traces. By analysing these environmental samples, scientists can gain a detailed snapshot of local biodiversity, tracking which species are present, their abundance, and their distribution. This non-invasive method has revolutionised ecological assessments, yielding a depth of information previously unattainable through conventional techniques.

    Machine learning, a subset of artificial intelligence, has likewise emerged as a valuable asset in this domain. By discerning subtle patterns within extensive datasets, it can identify the complex interplay between environmental pressures and biological communities. This enables researchers to pinpoint the principal drivers of biodiversity loss and to develop targeted, data-driven strategies for conservation.

    A Breakthrough Study: Merging eDNA and Machine Learning

    Recent research in Switzerland has illustrated the transformative potential of combining eDNA and machine learning. Focusing on 64 monitoring sites, the study concentrated on freshwater macroinvertebrates—organisms that serve as vital indicators of aquatic health. By training a machine learning model to distinguish between reference and impacted sites from eDNA data, the scientists achieved an accuracy of 69.1%, significantly exceeding the 59.5% accuracy of traditional morpho-taxonomic methods reliant on physical traits.

    Methods and Results: A Deeper Dive

    This study employed eDNA metabarcoding coupled with machine learning to assess freshwater ecosystems.

    eDNA Metabarcoding: The researchers amplified a 142-bp fragment of the COI marker from water samples taken across 64 sites in Switzerland. Sequencing the resulting genetic material allowed them to identify operational taxonomic units (OTUs) at a 97% identity threshold, providing a comprehensive overview of local biodiversity.

    Machine Learning: The team applied a supervised machine learning approach using a Random Forest algorithm, which employed Gini impurity as a measure of importance. Trained on the genetic profiles of reference and impacted sites, the model successfully predicted land-use classes (e.g. pristine versus degraded) with impressive accuracy.

    A Primer on the Random Forest Algorithm

    The Random Forest algorithm is like a super-smart decision-making team made up of lots of “mini-experts” called decision trees. Each decision tree in the team gets a say in making a final decision, and they work together to give a reliable answer. How does it work?

    Imagine you are trying to decide the best place to plant trees to help wildlife. You ask a group of environmental experts (the decision trees) for their opinions. Each expert looks at different information—like soil type, sunlight, or nearby animals—and makes a suggestion. They do not all see the same data, so their ideas vary. Once they have shared their opinions, the group votes, and the most popular answer wins. This is how Random Forest works: it combines the wisdom of many “experts” to make reliable predictions about complex problems like the best habitat for trees or the health of an ecosystem.

    Now, back to the research…

    Key Findings: The Strength of eDNA and Its Significance The Swiss study demonstrated that machine learning models built from eDNA data can surpass or match traditional methods in identifying human impacts on ecosystems. Notably, these eDNA-based models excelled at detecting urban and agricultural pressures in river systems.

    Moreover, eDNA techniques unveiled a wealth of previously undetected species. While traditional sampling identified 86 organismal types, eDNA analysis revealed more than 1,600 unique genetic groups. This expanded perspective not only enriches our understanding of biodiversity but also bolsters ecosystem assessments and subsequent conservation measures.

    Refining Monitoring with Advanced Tools

    Why does this matter? Historically, monitoring has often depended on the manual collection and identification of specimens—an approach that can be slow, costly, and reliant on specialist knowledge. The Swiss research showed that integrating eDNA with machine learning yields three distinct advantages:

    1. Enhanced Coverage Across Scales: eDNA can capture biodiversity patterns across larger spatial and temporal scales. Its capacity to track how genetic material disperses through water bodies even reveals upstream impacts, providing deeper insights than traditional sampling alone.

    2. Richer and More Comprehensive Data: DNA-based methods detect a broader array of species, including those overlooked by conventional techniques. Diptera (flies), for instance, displayed far greater diversity when assessed through eDNA rather than standard morphological identification.

    3. Improved Cost and Time Efficiency: Once DNA is collected and sequenced in the laboratory, researchers can apply machine learning to interpret results rapidly, reducing labour-intensive steps and accelerating data analysis.

    The Role of Machine Learning: Turning Data into Action

    Machine learning excels in handling eDNA’s inherently complex and expansive datasets, often comprising numerous genetic markers. Traditional methods might disregard sequences that lack a perfect match in existing reference libraries. However, machine learning can incorporate these unlabelled markers, yielding improved predictions and uncovering meaningful ecological patterns. This approach does more than replicate past techniques—it extends and refines them, transforming our capacity to recognise environmental changes and respond swiftly.

    What’s Next for Environmental Monitoring?

    The integration of eDNA and machine learning opens several doors for future applications.

    Broadening Classifications: Beyond binary distinctions between “impacted” and “pristine” sites, advanced models could differentiate multiple environmental quality levels, informing more nuanced conservation measures.

    Finer-Scale Monitoring: As techniques mature, scientists may use these methods to track seasonal fluctuations, long-term changes, and spatial differences in biodiversity, enabling a more dynamic understanding of ecosystems.

    Accessible Innovations: Automated, data-driven approaches may reduce costs and technical barriers, allowing a wider range of organisations and regions to harness cutting-edge tools for biodiversity monitoring.

    Informed Policy and Conservation: Reliable, accessible, and detailed data offer policymakers and stakeholders the insight they need to target the most pressing environmental challenges effectively and promptly.

    Transforming Conservation with Data-Driven Solutions

    The alliance between innovative technologies and environmental science is reshaping our approach to biodiversity protection. By illuminating hidden patterns and lifeforms, eDNA offers a gateway to understanding ecosystems as never before, while machine learning refines these insights into concrete, actionable guidance.

    As the pressures on our natural habitats intensify, tools that are faster, more efficient, and readily scalable become indispensable. The synergy of eDNA and artificial intelligence exemplifies this progress, enriching our understanding of human impacts on biodiversity and guiding us towards measured, effective interventions.

    Let’s Stay Ahead of the Curve

    In an era defined by environmental uncertainty, blending genetic data with advanced analytics provides a promising pathway forward. Interdisciplinary solutions—unifying AI, molecular biology, ecology, and conservation—are meeting some of the greatest sustainability challenges of our time. Are you curious about the future of ecosystem monitoring? Let’s continue the conversation—connect and share your thoughts!

  • Using eDNA to Trace the True Origin of Honey: Insights from Indonesian Beekeeping Practices

    Using eDNA to Trace the True Origin of Honey: Insights from Indonesian Beekeeping Practices

    Honey, often called “liquid gold,” has been cherished across cultures for its health benefits, culinary versatility, and even symbolic significance. Yet, beyond its sweetness and nutritional value, honey holds a wealth of untapped information about its origins. A recent study in Karangasem, Bali, Indonesia, showcases how modern DNA analysis techniques can trace the geographical and botanical sources of honey, shedding light on its unique identity and offering insights into sustainable beekeeping practices.

    Karangasem, located in eastern Bali, is renowned for its exceptional biodiversity, encompassing both lush terrestrial landscapes and vibrant marine ecosystems. Indigenous plant species such as Syzygium (known locally as Jambu Klampok or Jambu Mawar) and Schleichera (Kesambi wood) play a vital role in shaping the region’s natural environment. These plants are not just ecological fixtures; they also influence the characteristics of honey produced by local bees. Among the prized varieties is Karangasem’s “black honey,” a unique product derived from the region’s tropical forests. Harvested by local bees that forage on a diverse array of flora, this honey boasts a distinct flavour profile reflective of its botanical heritage.

    The Importance of Honey Authenticity

    In today’s globalized market, ensuring the authenticity of food products is a pressing concern for consumers and producers alike. Honey, particularly premium varieties associated with specific regions, has become a prime target for fraud. Counterfeit products, often mislabelled or adulterated, undermine consumer trust, and devalue genuine honey. This issue is especially problematic for local beekeepers, whose livelihoods depend on the reputation and quality of their honey. Mislabelling not only diminishes their income but also erodes the cultural and ecological connections that authentic honey embodies.

    By pinpointing the exact origins of honey, producers can safeguard their products’ integrity, protect local branding, and assure consumers of its quality. Modern scientific advancements, such as DNA metabarcoding, offer a powerful tool to achieve this, providing unparalleled insights into the complex journey from flower to hive to table.

    Pollen DNA Metabarcoding: A Window into Honey’s Origins

    Pollen DNA metabarcoding represents a cutting-edge approach to uncovering honey’s botanical and geographical roots. This technique analyses trace pollen DNA found in honey to identify the plant species that bees foraged on. By mapping these plant signatures, scientists can trace honey back to its floral and regional sources with remarkable precision.

    In Karangasem, researchers applied this technology to honey produced by two key bee species: the Asian honey bee (Apis cerana) and the Itama stingless bee (Heterotrigona itama). These bees represent different foraging behaviours and ecological niches, making them ideal subjects for studying the interplay between flora and honey production.

    The Science in Action: How DNA Analysis Works

    The study followed a process to extract and analyse DNA from honey, overcoming challenges posed by its high sugar content. The key steps included:

    Sample Collection: Honey samples were collected from Karangasem’s biodiversity-rich areas to ensure they reflected the region’s unique floral composition.

    DNA Extraction: Specialized techniques were used to isolate DNA from the honey. The high sugar concentration in honey can interfere with DNA extraction, requiring careful optimisation.

    Sequencing and Bioinformatics: A specific primer (ITS2) was used to amplify the pollen DNA. This genetic data was then processed using advanced bioinformatics tools to identify the plant species present.

    Key Findings: Decoding the Floral Signatures of Honey

    The analysis revealed fascinating insights into the floral preferences of the two bee species:

    • Apis cerana honey: This honey contained pollen from 11 diverse plant genera, reflecting the bees’ broad foraging range. The genus Schleichera (Kesambi) was the most dominant, accounting for 72.8% of the pollen composition.
    • Heterotrigona itama honey: In contrast, this honey exhibited a near-monodominance of Syzygium (Jambu Klampok), which constituted 99.95% of its pollen.

    These differences highlight the distinct foraging strategies of the two species. While Apis cerana explores a variety of plants, H. itama tends to focus on specific floral sources, resulting in honey with a more uniform botanical profile.

    Connecting Honey to Its Geographic Roots

    The study confirmed that all plant DNA in the honey samples matched species native to the Karangasem region. This strong link between the honey and its local flora reinforces its authenticity, offering a scientific basis to protect local honey brands from misrepresentation.

    Interestingly, a comparative analysis of Indonesian and Malaysian honey revealed overlapping plant genera, such as Syzygium. However, each region displayed unique floral profiles. Indonesian honey, for instance, featured Schleichera, Artocarpus, and Mangifera, while Malaysian honey included Corynandra and Acacia. These distinctions underscore how geography shapes honey’s identity and highlight the rich biodiversity of Southeast Asia.

    Molecular Techniques vs. Traditional Methods

    Traditionally, honey’s origin has been determined through melissopalynology—the microscopic examination of pollen grains. While dependable, this method is time-intensive and depends heavily on expert interpretation. DNA metabarcoding offers a faster, more precise alternative. By providing high-resolution data, this approach enables researchers and producers to trace honey’s origins more efficiently and accurately, making it a valuable tool for both scientific research and commercial applications.

    Beyond Indonesia: Implications for the Global Honey Industry

    The findings from Karangasem carry broader implications for the global honey market. Similar techniques can be applied worldwide to:

    • Authenticate honey products and combat counterfeit goods.
    • Analyse how environmental changes and land use impact bee foraging patterns.
    • Enhance the value of honey by verifying its premium quality and unique origins.

    By adopting DNA-based authentication methods, the global honey industry can promote transparency, protect local producers, and meet the growing consumer demand for traceable, ethical products.

    Advancing Sustainability in Beekeeping: A Sweet Path Forward

    The study from Karangasem offers a compelling example of how traditional knowledge and modern science can work together to protect and celebrate honey’s authenticity. By tracing its floral and geographical roots, we preserve the integrity of honey as a product deeply connected to its environment. With advancements like DNA metabarcoding, we can ensure that every drop of honey tells a story that is unadulterated, authentic, and deeply rooted in the environment it comes from.

    This research highlights the critical role of sustainable beekeeping practices in preserving biodiversity and supporting ecological balance. By understanding the foraging behaviours and floral preferences of local bees, farmers can preserve native plant species, ensure a stable food source for pollinators, and align honey production with natural ecosystems to minimise environmental impact. These efforts are crucial for maintaining the health of bee populations, which are essential for pollination and broader biodiversity.

    Moreover, empowering local communities through the production of authentic, region-specific honey strengthens their market position and fosters economic resilience. As consumer preferences shift toward sustainably produced goods, initiatives like this not only protect the environment but also offer significant economic benefits.