Understanding biodiversity in forest ecosystems is fundamental to assessing environmental health and guiding conservation strategies. Yet, for all our advances in ecological science, one part of these ecosystems has remained largely invisible: the microbial life beneath our feet. A recent study led by a German research team has opened up a bold new frontier in biodiversity monitoring by combining environmental DNA (eDNA) with satellite hyperspectral data. The result? A powerful methodology for predicting microbial diversity in forest soils at unprecedented scales.
By uniting these two innovative tools—molecular biology and remote sensing—the researchers have demonstrated a way to bridge the microscopic and the landscape-level. Their findings could reshape how we monitor biodiversity, manage forests, and respond to ecological change.
Why Soil Microbiomes Matter—And Why They’re Hard to Track
Soil microbiomes play a vital role in the function and resilience of forest ecosystems. These bacterial and fungal communities regulate carbon and nitrogen cycles, support plant growth, and contribute to disease suppression. Despite their importance, tracking microbial diversity over time and space has always been challenging. Traditional methods rely on physical sampling and laboratory analysis—processes that are labour-intensive, geographically limited, and often disconnected from the broader landscape context.
A Visionary Question
At the heart of the research was a deceptively simple question: Can we use satellite imagery, combined with genomic tools, to accurately map soil microbial diversity across forested landscapes?
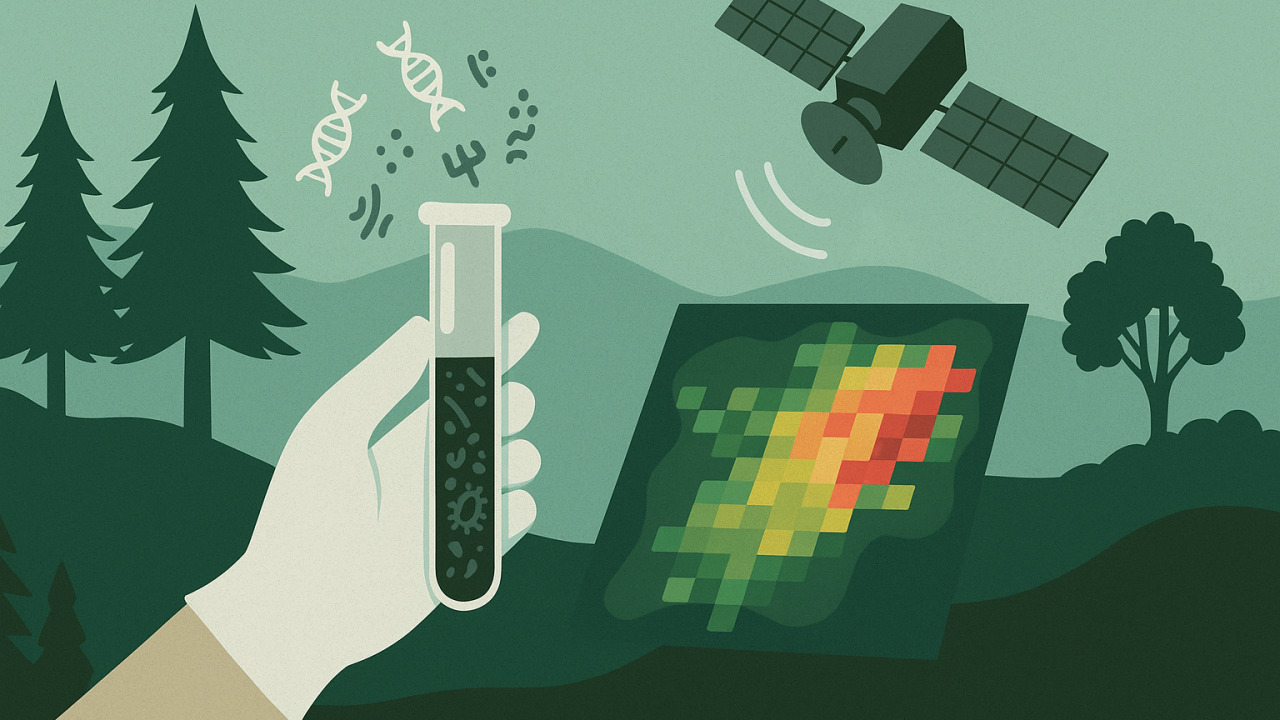
Environmental DNA (eDNA) can detect thousands of microbial species from a small soil sample, offering fine-scale biological insight. In parallel, hyperspectral imaging from satellites like the DESIS (DLR Earth Sensing Imaging Spectrometer) captures detailed spectral and spatial data about ecosystems at large scales. The hypothesis was that, together, these methods could identify microbial diversity patterns and link them to broader environmental variables—such as forest type, elevation, and soil chemistry.
In short: use DNA to understand who is present, and satellite data to understand why.
Methodology: A Meeting of Scales
To test their hypothesis, the researchers designed a study that spanned three forest sites across Europe: the Bavarian Forest National Park in Germany, and the Hoge Veluwe and Veluwezoom National Parks in the Netherlands. These areas represent a variety of forest types, soil conditions, and topographies—ideal for assessing how microbial diversity responds to environmental gradients.
Soil samples were collected from each location and subjected to high-throughput DNA sequencing. Microbial species were identified using global databases like SILVA (for bacteria) and UNITE (for fungi), and alpha diversity metrics—including the Shannon Index, functional richness, and phylogenetic diversity—were calculated.
In parallel, hyperspectral reflectance data were collected across 235 spectral bands using DESIS satellite imagery. This data was atmospherically and geometrically corrected to ensure spatial accuracy. Finally, the two datasets—eDNA-based diversity and hyperspectral data—were integrated using Gaussian Process Regression (GPR), a machine learning method well suited for identifying complex, non-linear relationships in ecological data.
What They Found: Microbial Hotspots from Space
The results were striking. The models successfully mapped areas of high and low microbial alpha diversity—what the researchers termed ‘hotspots’ and ‘cold spots’—across the study sites. In the Bavarian Forest, alkaline soils were associated with increased bacterial and fungal diversity, whereas higher elevations appeared to limit bacterial richness. In the flatter Dutch forests, elevation was less important, but soil pH remained a strong driver of fungal diversity.
These patterns were not only statistically robust but visually compelling. The team developed intuitive colour-coded maps that translated complex microbial data into spatially explicit, easy-to-read visualisations. These maps represent a new way of communicating biodiversity information—accessible to scientists, policymakers, and land managers alike.
The models themselves explained up to 50% of the variation in bacterial alpha diversity and 40% in fungal diversity, demonstrating that satellite spectral data can indeed serve as a proxy for microbial diversity when interpreted through the lens of eDNA.
Scaling Biodiversity Monitoring
Perhaps the most exciting implication of the study is its scalability. By coupling eDNA surveys with publicly available satellite data, this approach could be replicated across large, remote, or otherwise inaccessible regions. It offers a cost-effective and rapid way to monitor biodiversity and detect change—an especially powerful proposition in the context of climate adaptation and forest conservation.
Crucially, the technique holds promise not just for academic research but for applied environmental management. Forest managers could use these maps to identify areas of ecological sensitivity or degradation. Conservationists could prioritise biodiversity hotspots for protection or restoration. And governments could better report progress against global biodiversity frameworks such as the UN Sustainable Development Goals (SDGs) or the Convention on Biological Diversity (CBD).
Remaining Challenges and Open Questions
While the findings mark significant progress, there are limitations and open questions that future research must address. First, although explaining 40–50% of the variance in microbial diversity is impressive, it still leaves half unaccounted for. Could incorporating additional variables, such as historical land use, microclimatic data, or soil moisture, help refine the models further?
Second, the biological interpretation of hyperspectral data remains an emerging field. It’s not yet fully understood why certain spectral bands are so strongly associated with microbial diversity. Are we seeing the spectral fingerprint of the microbes themselves? Or is the signal coming from correlated variables like vegetation, soil texture, or organic matter?
Third, the approach needs to be tested in more diverse ecosystems. Tropical rainforests, arid shrublands, and peat bogs each present their own environmental challenges and microbial communities. Expanding this method across biomes will be key to validating its general utility.
Toward an Interdisciplinary Future
One of the most powerful aspects of this study is its unification of disciplines. Genomic science and Earth observation have traditionally operated in separate domains. By bringing them together, this research offers a model for the kind of interdisciplinary innovation needed to solve today’s complex environmental problems.
As technology advances and satellite resolution improves, we can expect to see even more detailed biodiversity assessments made possible from space. Meanwhile, molecular methods like eDNA continue to evolve, offering richer insights into community structure, function, and change over time.
When combined, these tools allow us to move from reactive conservation—based on limited field surveys—to proactive landscape-scale planning that incorporates biological complexity in real time.
As the twin crises of climate change and biodiversity loss escalate, tools like this offer both clarity and hope. Clarity helps us understand where biodiversity is flourishing or faltering, and we hope that we can act in time to protect it.
What possibilities do you see in combining molecular data with remote sensing? Could these methods inform your work in conservation, agriculture, forestry, or land restoration? Let’s open the discussion.
Leave a Reply